Step 3: Start Evaluation
-
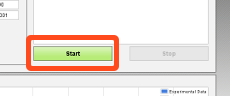
You may now start the evaluation. Click the big green Start button.
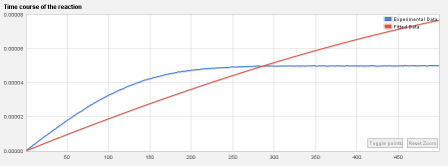
While the evaluation is running, curve fitting is shown in real-time on the Time Course of the Reaction chart.
Evaluated parameters are shown approximately every second during the evaluation (depending on the evaluation speed).
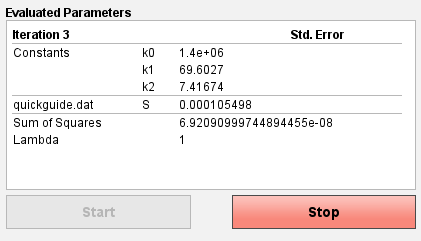
The decreasing lambda value indicates a successful convergence of the fitting procedure.
The sum of squares measures the difference between the measured and the fitted values of the dependent variable.
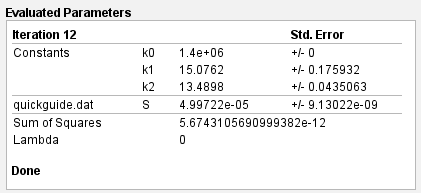
You may stop the evaluation at any time by pressing the Stop button.When the evaluation finishes, either by converging or by reaching the iteration limit, the final evaluated parameters will be shown.
-
You can try changing any parameter and see how the evaluation process changes.
This is all for the quick guide! Happy fitting!